Hands-On Math Graph Cubes provides an interactive learning environment for developing skills and concepts related to data analysis. It is a perfect classroom tool for core mathematics instruction and enrichment for teachers who want to strengthen graph reading and interpreting skills. While using this app students will conduct surveys of their classmates and represent the results of data collection in a bar graph that is assembled by stacking virtual cubes on a grid. The skills learned are relevant to the elementary mathematics curriculum. Encourage your students to try Hands-On Math Graph Cubes, and as they do you will see them get better at many basic math skills including the following: |
Graph Cube offers a variety of sticker collections which are used to label the graph. Colored cubes are used to create a vertical bar graph. Younger learners will benefit from the optional auditory feedback that is provided as they manipulate cubes and stickers. |
Targeted Mathematical Development in the Following Areas:
Data Analysis |
Constructing Surveys, Collecting Data, Representing Data in a Graph, Reading a Graph Accurately, Using Graphs and Tables to Answer Questions | |
Number Sense |
Comparisions, (<, =, or >) | |
Computation |
Addition and Subtraction of Whole Numbers | |
Logic and Reasoning |
Solving Logical Problems Using the Scientific Method, Deductive Reasoning |
Sticker Sets:
| Categories | ||
|
|
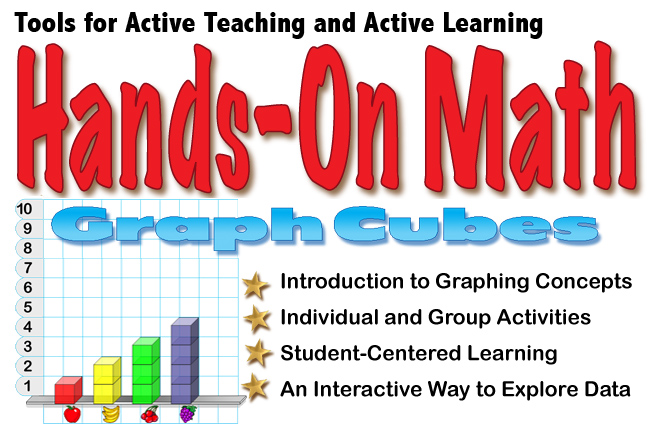
Hands-On Math Graph Cubes
Collecting, Organizing and Describing Data Based on Real-Life Situations For students, learning about the opinions of their classmates can be fun. Graph Cubes goes beyond drill and practice and presents students with an interactive tool that encourages self-expression, creativity and learning through discovery. By surveying classmates students get to know each other better and they also learn about how graphs are used to communicate information. Videos: |
Hands-On Math Graph Cubes creates a virtual mathematical playground right on your iPad. It simulates the use of a popular math manipulative color cubes and combines it with a creative tool for building graphs. It is perfect for elementary and middle school classrooms. Enrich your mathematics curriculum with Hands-On Math Graph Cubes. The ability to graph and interpret data is a critical skill. Everyday we encounter with graphs and tables designed to convey important information. Started in the primary grades students are asked to evaluate, interpret, understand and discuss data that is presented in a table or graph. Tables and graphs are important not just in math class but in other areas as well. Graphs are used to present historical information, perhaps showing trends, or population. In science the results of an experiment is often presented using a graph or table. It is not hard to see why data analysis has become a major goal of the K-12 curriculum. Hands-On Math Graph Cubes can help students develop data analysis skills. These skills must be learned early and reinforced often. Several important areas of the graphing and data analysis curriculum can be addressed using this app:
We recommend that you open the Instructor's Guide PDF from your iPad in a new browser page and save the document in your iBooks app. |
Getting Started |
Sample Graphs |
Editing Graph Data |
|
Features:
|
 |
$2.99 |
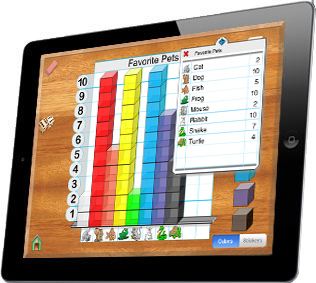
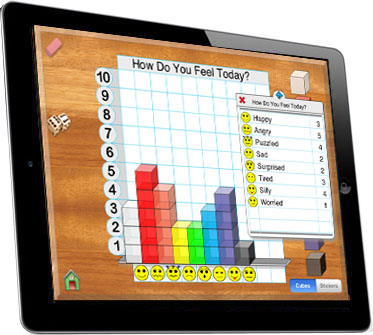
| Graph Cubes Graph Cubes is a fun way to introduce data analysis skills. Using simple gestures students move and place cubes on a grid to build a graph. Student interaction with the graph is instantly reflected in a table. Changes made to the table are instantly reflected in the graph. Possible Topics:
|
|
|
Graph Cube Functions By dragging a cubes on to a grid, the student builds a graph. As the graph is built data corresponding the graph is assembled in a table.
|